
Test an association between categories
Source:vignettes/articles/docs/methods/associations.Rmd
associations.RmdThese methods test whether 2 categorical answers go together.
Assumptions. Use responses from independent respondents. The chi-square test needs expected counts of about 5 or more per cell, Fisher’s exact test does not.
In SurveyStudio, open Plan on the Design screen, add a research question and choose the method. Set 2 single-choice answers, 1 for the rows of the table and 1 for its columns. Declare the hypotheses and the decision rule before collecting responses.
Cross-tabulation
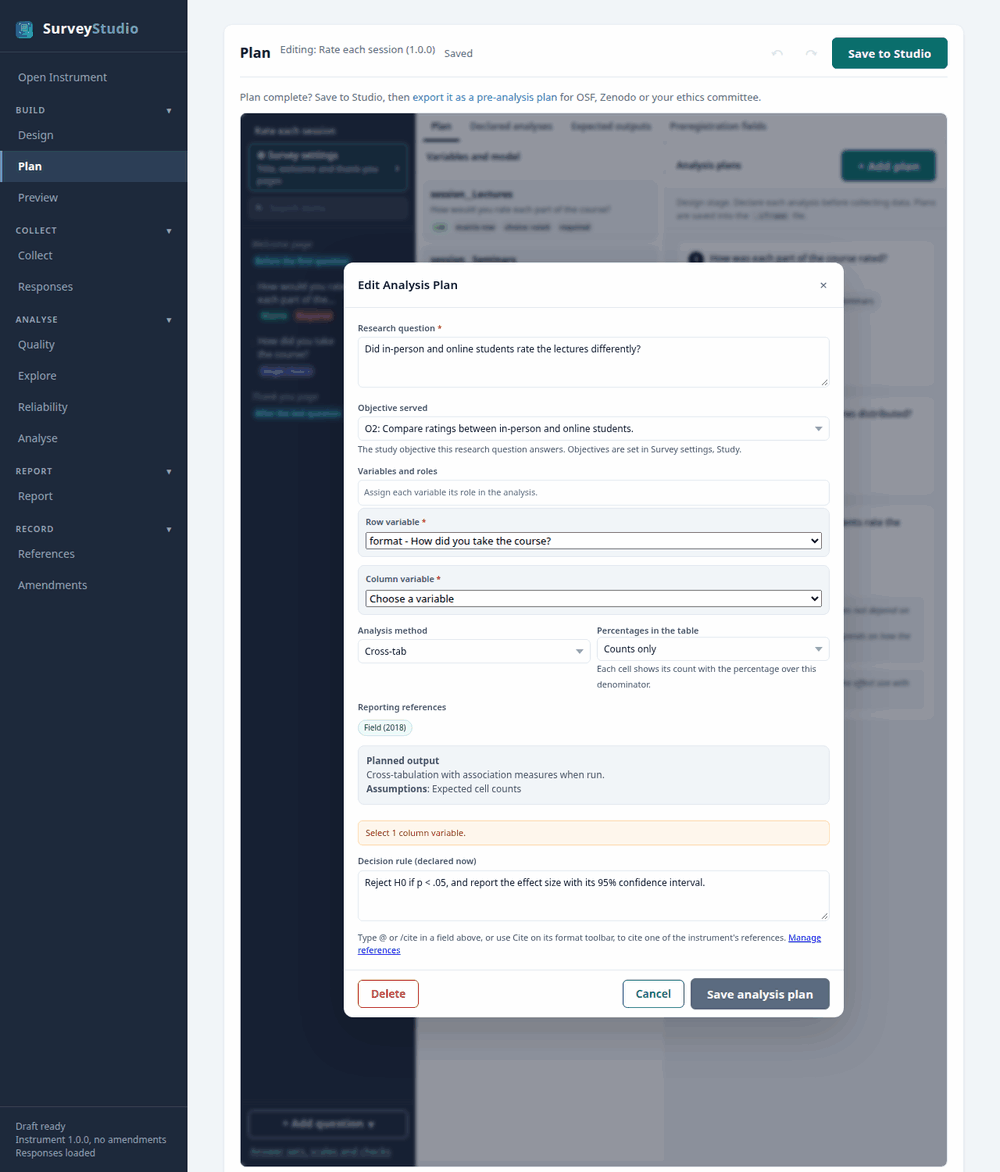
matrix_likert demo.In the pre-analysis plan:
RQ3. Did in-person and online students rate the lectures differently? Null hypothesis (H0): The rating of the lectures does not depend on how the course was taken. Alternative hypothesis (H1): The rating of the lectures depends on how the course was taken. Planned decision rule: Reject H0 if p < .05, and report the effect size with its 95% confidence interval.
In the report: the APA 7 sentence and a table, with a chart where the method has one, each titled with the research question.
Chi-square test of association
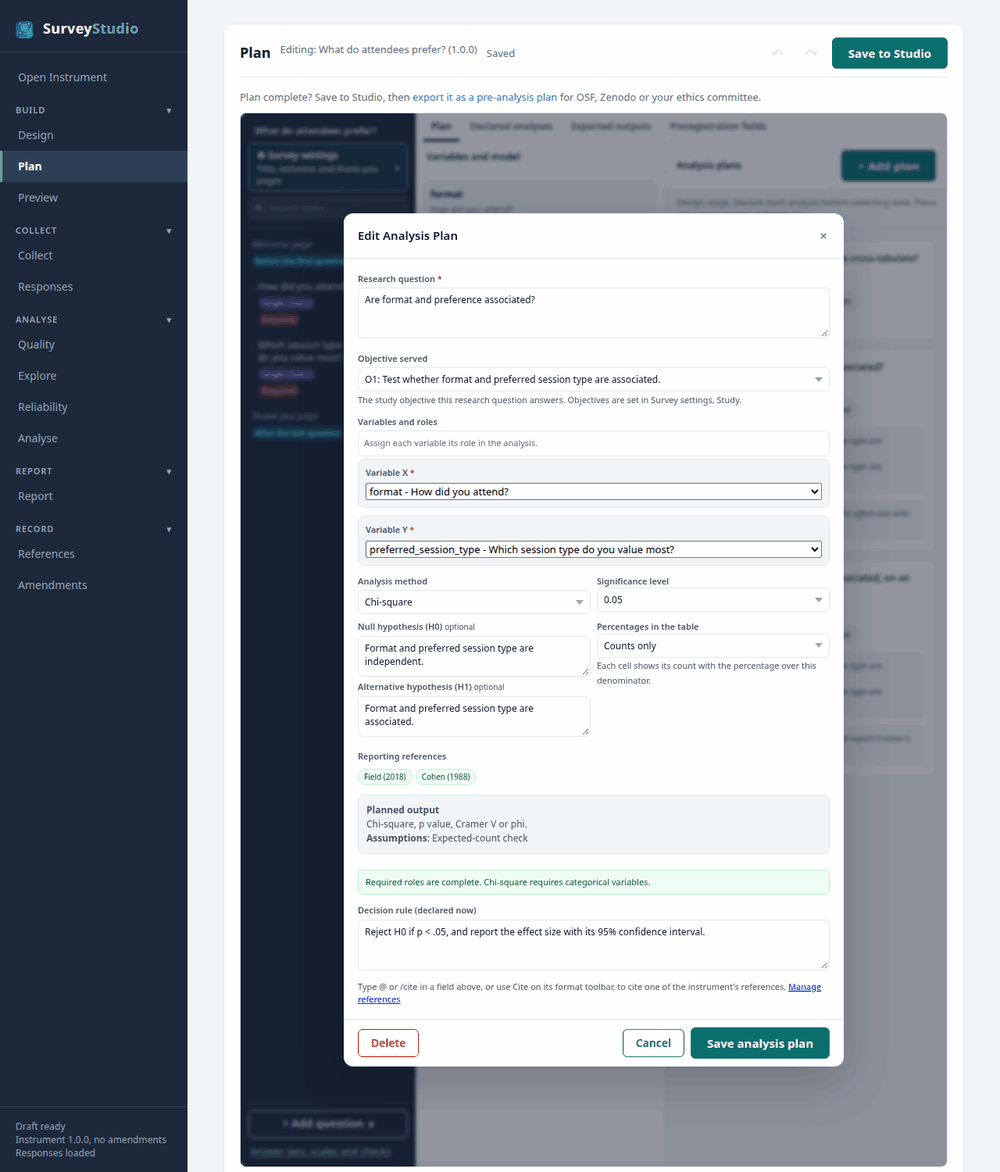
categorical demo.In the pre-analysis plan:
RQ2. Are format and preference associated? Null hypothesis (H0): Format and preferred session type are independent. Alternative hypothesis (H1): Format and preferred session type are associated. Planned decision rule: Reject H0 if p < .05, and report the effect size with its 95% confidence interval.
In the report: the APA 7 sentence and a table, with a chart where the method has one, each titled with the research question.
References: Field, A. (2018). Discovering statistics using IBM SPSS statistics (5th ed.). SAGE. Cohen, J. (1988). Statistical power analysis for the behavioral sciences (2nd ed.). Lawrence Erlbaum.
Fisher’s exact test
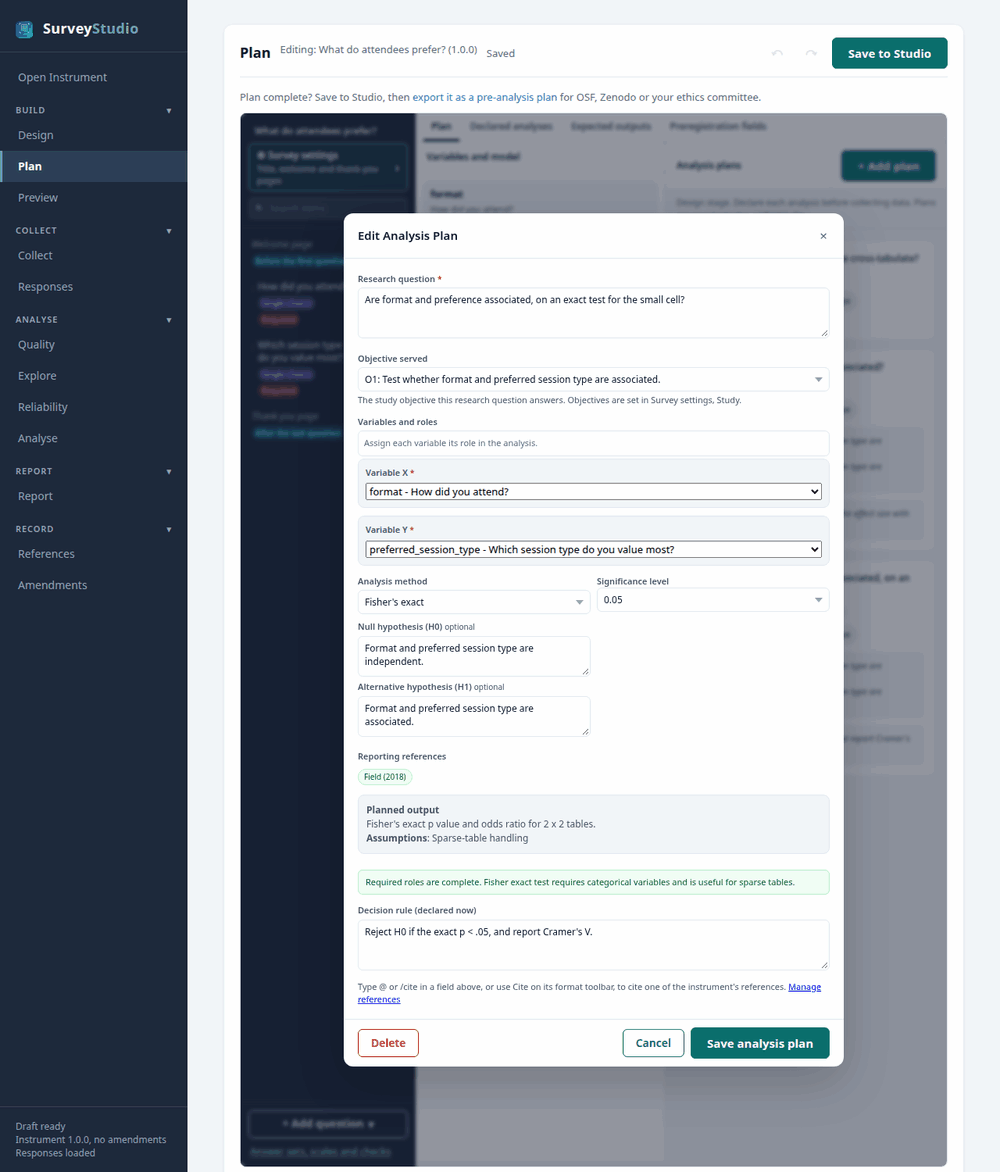
categorical demo.In the pre-analysis plan:
RQ3. Are format and preference associated, on an exact test for the small cell? Null hypothesis (H0): Format and preferred session type are independent. Alternative hypothesis (H1): Format and preferred session type are associated. Planned decision rule: Reject H0 if the exact p < .05, and report Cramer’s V.
In the report: the APA 7 sentence and a table, with a chart where the method has one, each titled with the research question.
References: Field, A. (2018). Discovering statistics using IBM SPSS statistics (5th ed.). SAGE. Cohen, J. (1988). Statistical power analysis for the behavioral sciences (2nd ed.). Lawrence Erlbaum.