
These methods estimate how much predictors explain a numeric outcome, or how they change the odds of a yes, an ordered rating or a choice.
Assumptions. Use independent respondents and predictors that are only loosely related to each other. For linear regression, use a straight-line relation with roughly normal residuals. Firth’s correction suits small samples and rare outcomes.
In SurveyStudio, open Plan on the Design screen, add a research question and choose the method. Set the outcome and 1 or more predictors. The outcome picks the model: a number for linear regression, a yes or no for binary logistic, an ordered rating for ordinal logistic, and a choice of 3 or more categories for multinomial logistic. Declare the hypotheses and the decision rule before collecting responses.
Linear regression
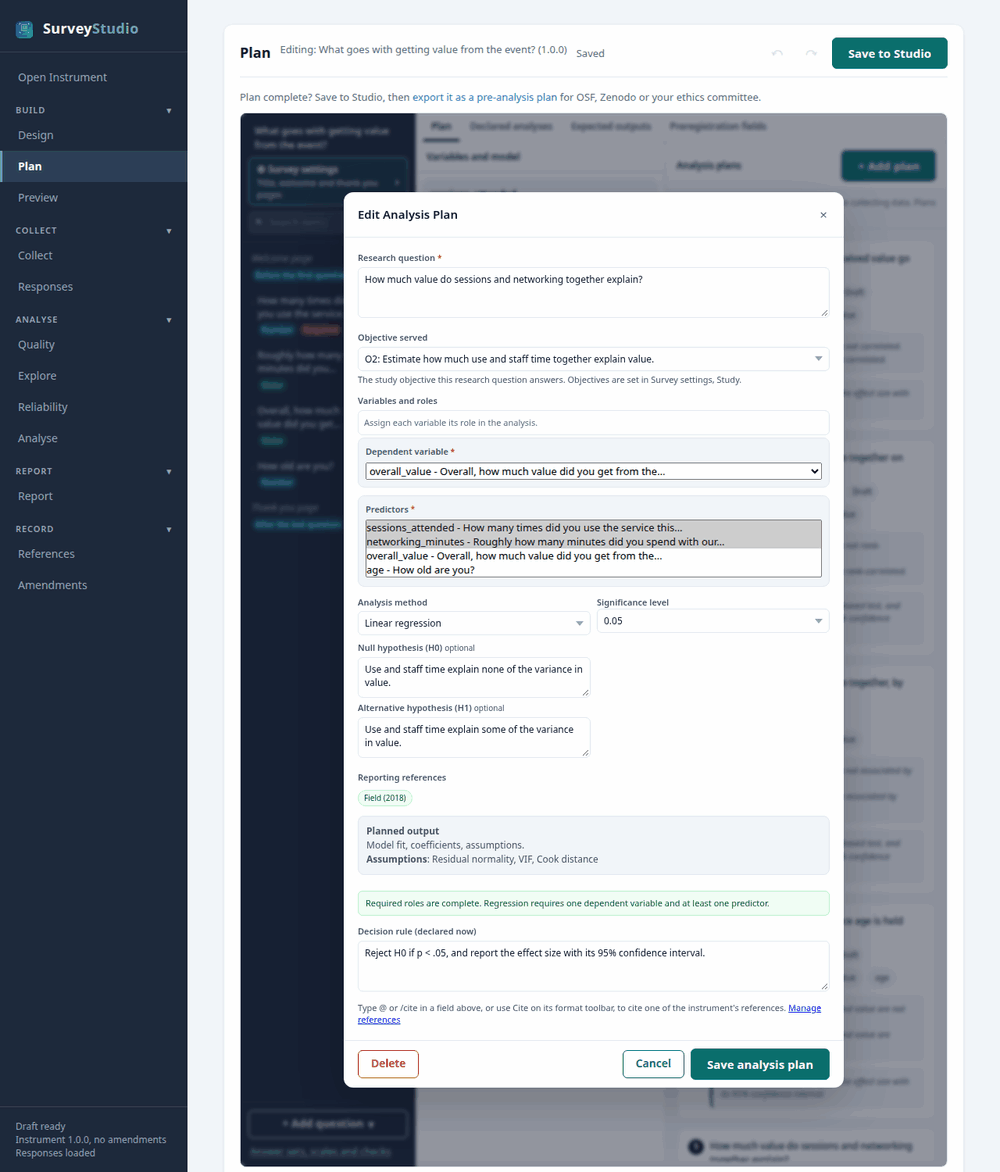
correlation_regression demo.In the pre-analysis plan:
RQ5. How much value do sessions and networking together explain? Null hypothesis (H0): Use and staff time explain none of the variance in value. Alternative hypothesis (H1): Use and staff time explain some of the variance in value. Planned decision rule: Reject H0 if p < .05, and report the effect size with its 95% confidence interval.
In the report: the APA 7 sentence and a table, with a chart where the method has one, each titled with the research question.
References: Field, A. (2018). Discovering statistics using IBM SPSS statistics (5th ed.). SAGE.
Binary logistic regression
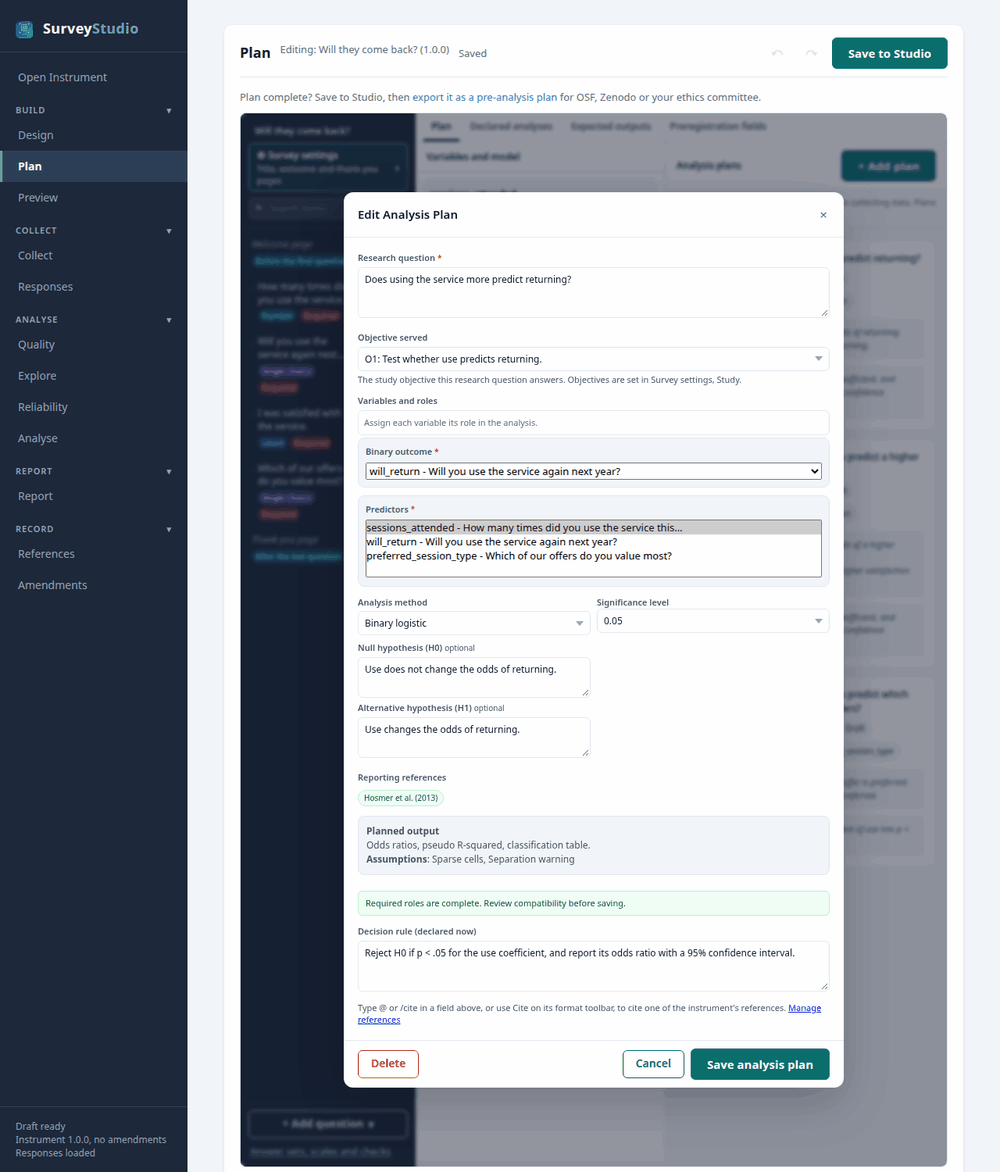
logistic demo.In the pre-analysis plan:
RQ1. Does using the service more predict returning? Null hypothesis (H0): Use does not change the odds of returning. Alternative hypothesis (H1): Use changes the odds of returning. Planned decision rule: Reject H0 if p < .05 for the use coefficient, and report its odds ratio with a 95% confidence interval.
In the report: the APA 7 sentence and a table, with a chart where the method has one, each titled with the research question.
References: Hosmer, D. W., Lemeshow, S., & Sturdivant, R. X. (2013). Applied logistic regression (3rd ed.). Wiley.
Ordinal logistic regression
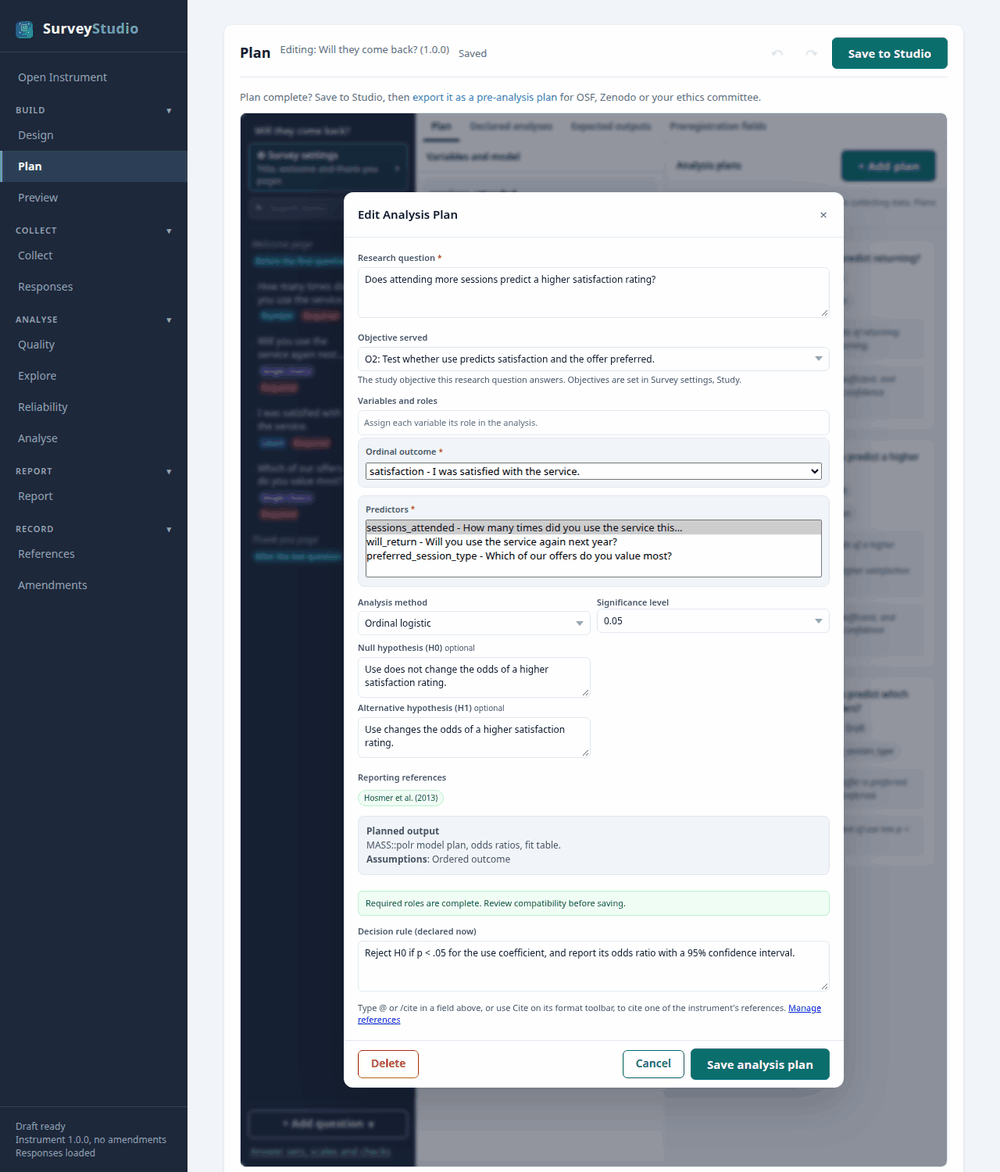
logistic demo.In the pre-analysis plan:
RQ2. Does attending more sessions predict a higher satisfaction rating? Null hypothesis (H0): Use does not change the odds of a higher satisfaction rating. Alternative hypothesis (H1): Use changes the odds of a higher satisfaction rating. Planned decision rule: Reject H0 if p < .05 for the use coefficient, and report its odds ratio with a 95% confidence interval.
In the report: the APA 7 sentence and a table, with a chart where the method has one, each titled with the research question.
References: Hosmer, D. W., Lemeshow, S., & Sturdivant, R. X. (2013). Applied logistic regression (3rd ed.). Wiley.
Multinomial logistic regression
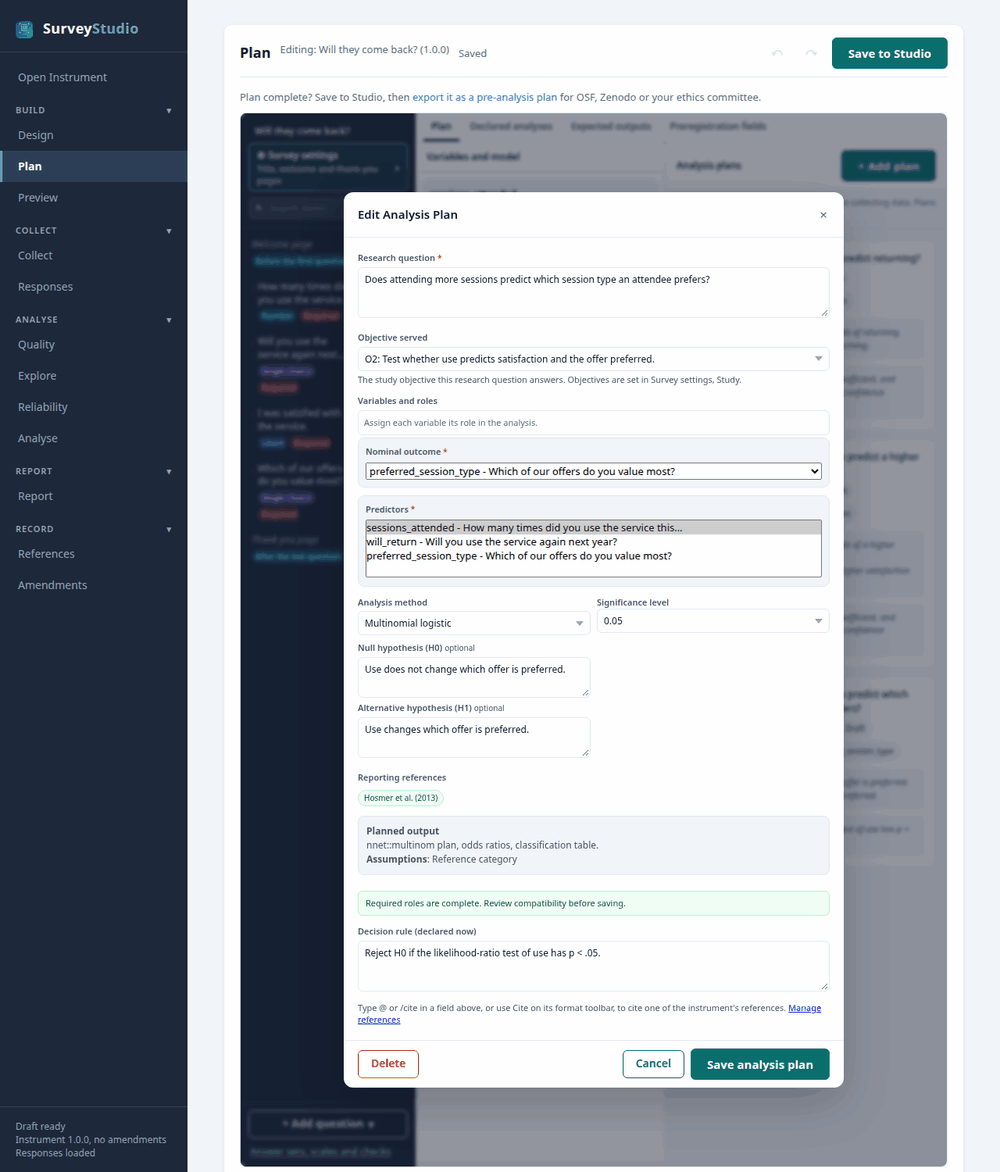
logistic demo.In the pre-analysis plan:
RQ3. Does attending more sessions predict which session type an attendee prefers? Null hypothesis (H0): Use does not change which offer is preferred. Alternative hypothesis (H1): Use changes which offer is preferred. Planned decision rule: Reject H0 if the likelihood-ratio test of use has p < .05.
In the report: the APA 7 sentence and a table, with a chart where the method has one, each titled with the research question.
References: Hosmer, D. W., Lemeshow, S., & Sturdivant, R. X. (2013). Applied logistic regression (3rd ed.). Wiley.
Firth logistic regression
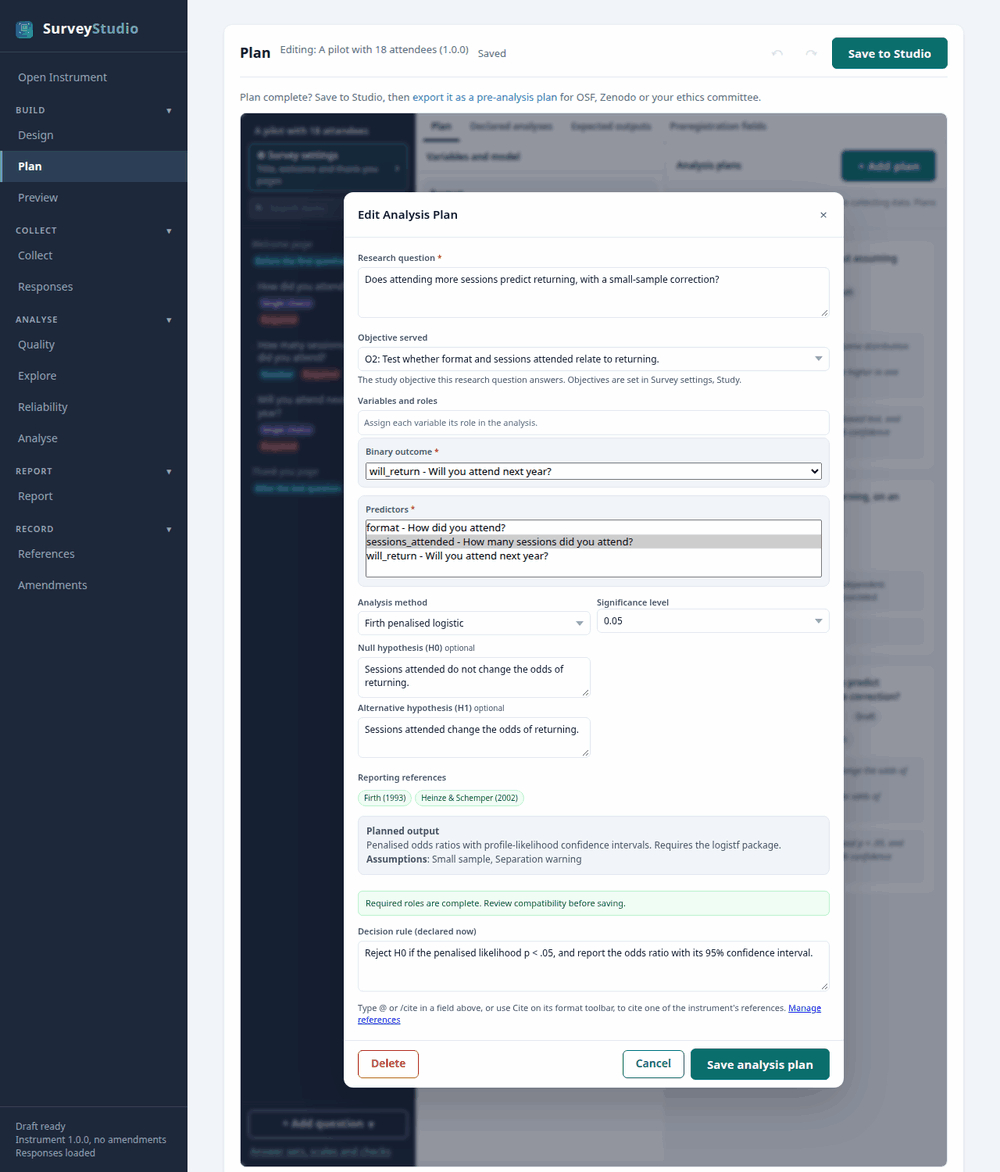
small_sample demo.In the pre-analysis plan:
RQ3. Does attending more sessions predict returning, with a small-sample correction? Null hypothesis (H0): Sessions attended do not change the odds of returning. Alternative hypothesis (H1): Sessions attended change the odds of returning. Planned decision rule: Reject H0 if the penalised likelihood p < .05, and report the odds ratio with its 95% confidence interval.
In the report: the APA 7 sentence and a table, with a chart where the method has one, each titled with the research question.
References: Hosmer, D. W., Lemeshow, S., & Sturdivant, R. X. (2013). Applied logistic regression (3rd ed.). Wiley. Firth, D. (1993). Bias reduction of maximum likelihood estimates. Biometrika, 80(1), 27-38. Heinze, G., & Schemper, M. (2002). A solution to the problem of separation in logistic regression. Statistics in Medicine, 21(16), 2409-2419.