
Compare the same people over time
Source:vignettes/articles/docs/methods/repeated-measures.Rmd
repeated-measures.RmdThese methods test whether answers change between 2 or more measurements of the same respondents.
Assumptions. Measure each respondent every time. The paired t-test and repeated measures ANOVA assume roughly normal differences, the rank-based tests do not. McNemar and Cochran’s Q take yes or no answers.
In SurveyStudio, open Plan on the Design screen, add a research question and choose the method. Set 2 or more measurements of the same respondents, each its own question, such as a rating before and after. Declare the hypotheses and the decision rule before collecting responses.
Paired samples t-test
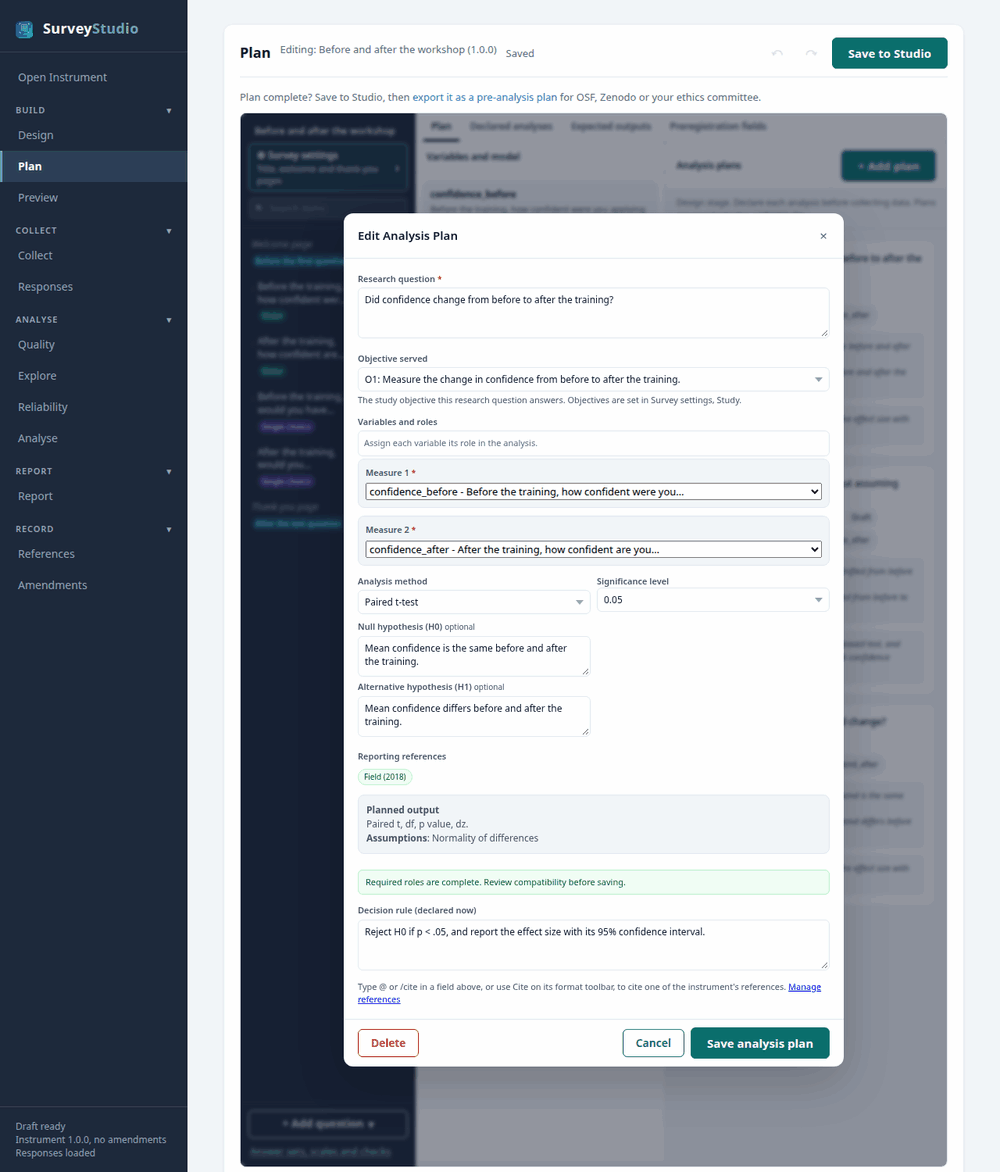
paired demo.In the pre-analysis plan:
RQ1. Did confidence change from before to after the training? Null hypothesis (H0): Mean confidence is the same before and after the training. Alternative hypothesis (H1): Mean confidence differs before and after the training. Planned decision rule: Reject H0 if p < .05, and report the effect size with its 95% confidence interval.
In the report: the APA 7 sentence and a table, with a chart where the method has one, each titled with the research question.
References: Field, A. (2018). Discovering statistics using IBM SPSS statistics (5th ed.). SAGE. Cohen, J. (1988). Statistical power analysis for the behavioral sciences (2nd ed.). Lawrence Erlbaum. Fisher, R. A. (1925). Statistical methods for research workers. Oliver & Boyd. Shapiro, S. S., & Wilk, M. B. (1965). An analysis of variance test for normality. Biometrika, 52(3-4), 591-611.
Wilcoxon signed-rank test
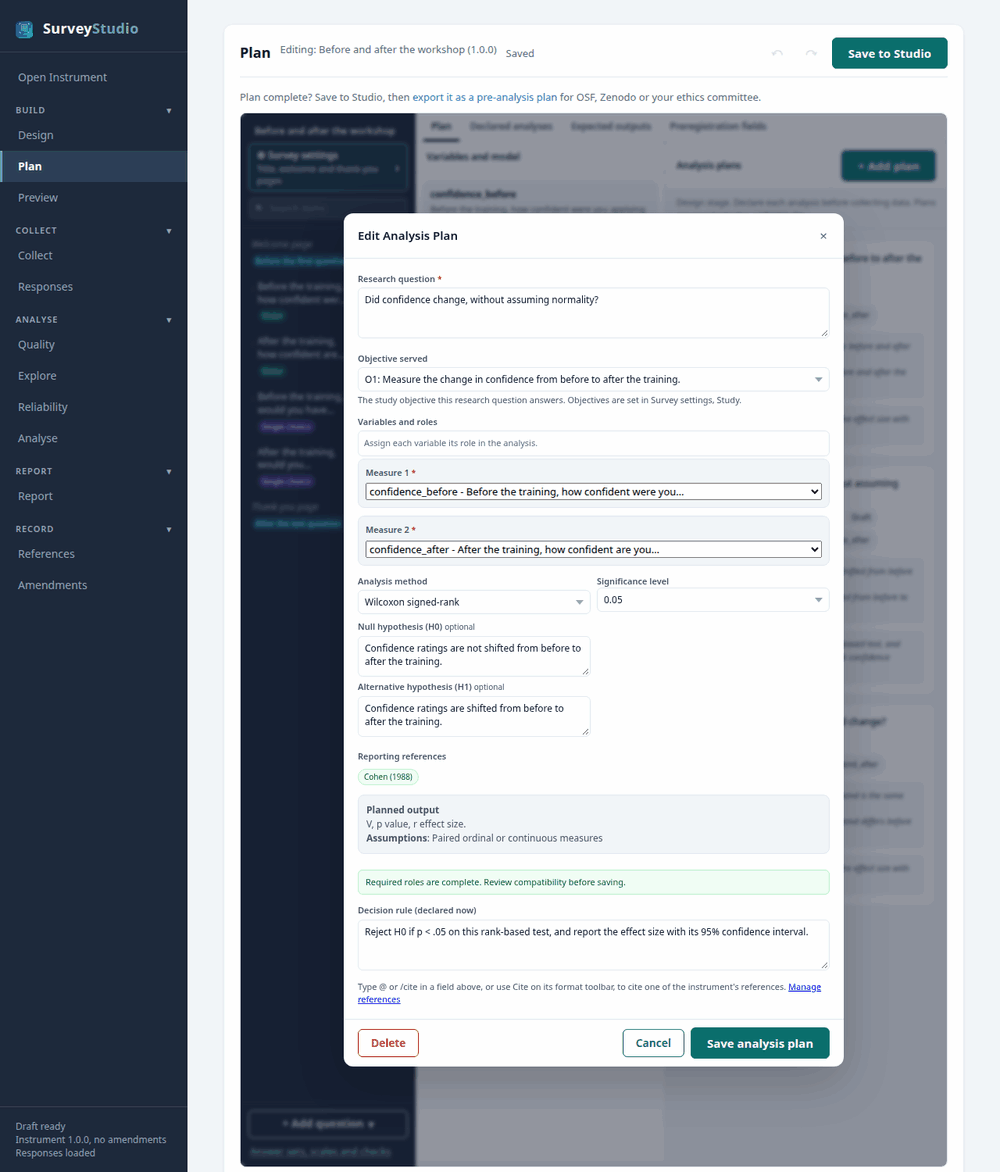
paired demo.In the pre-analysis plan:
RQ2. Did confidence change, without assuming normality? Null hypothesis (H0): Confidence ratings are not shifted from before to after the training. Alternative hypothesis (H1): Confidence ratings are shifted from before to after the training. Planned decision rule: Reject H0 if p < .05 on this rank-based test, and report the effect size with its 95% confidence interval.
In the report: the APA 7 sentence and a table, with a chart where the method has one, each titled with the research question.
References: Cohen, J. (1988). Statistical power analysis for the behavioral sciences (2nd ed.). Lawrence Erlbaum. Shapiro, S. S., & Wilk, M. B. (1965). An analysis of variance test for normality. Biometrika, 52(3-4), 591-611.
McNemar test
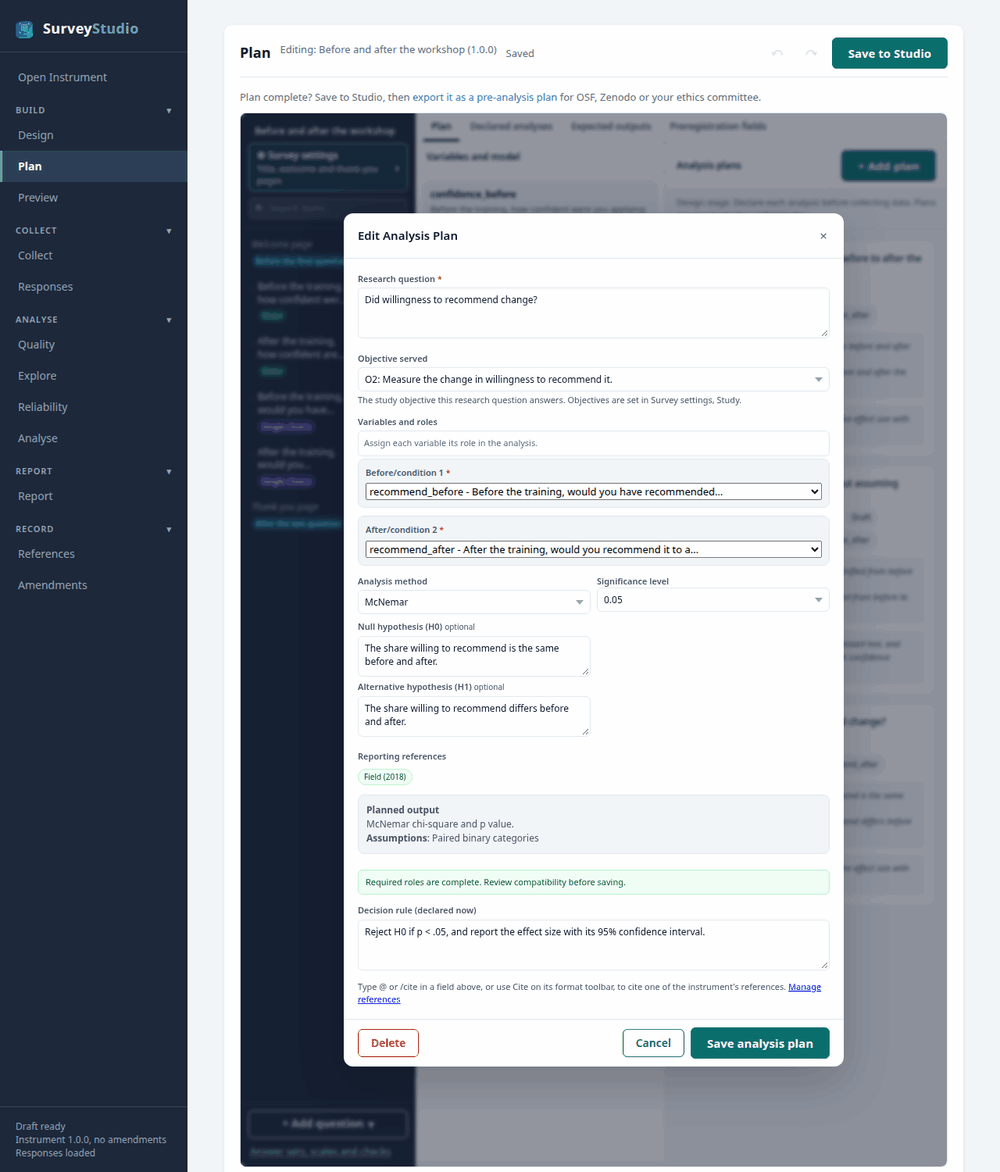
paired demo.In the pre-analysis plan:
RQ3. Did willingness to recommend change? Null hypothesis (H0): The share willing to recommend is the same before and after. Alternative hypothesis (H1): The share willing to recommend differs before and after. Planned decision rule: Reject H0 if p < .05, and report the effect size with its 95% confidence interval.
In the report: the APA 7 sentence and a table, with a chart where the method has one, each titled with the research question.
Repeated measures ANOVA
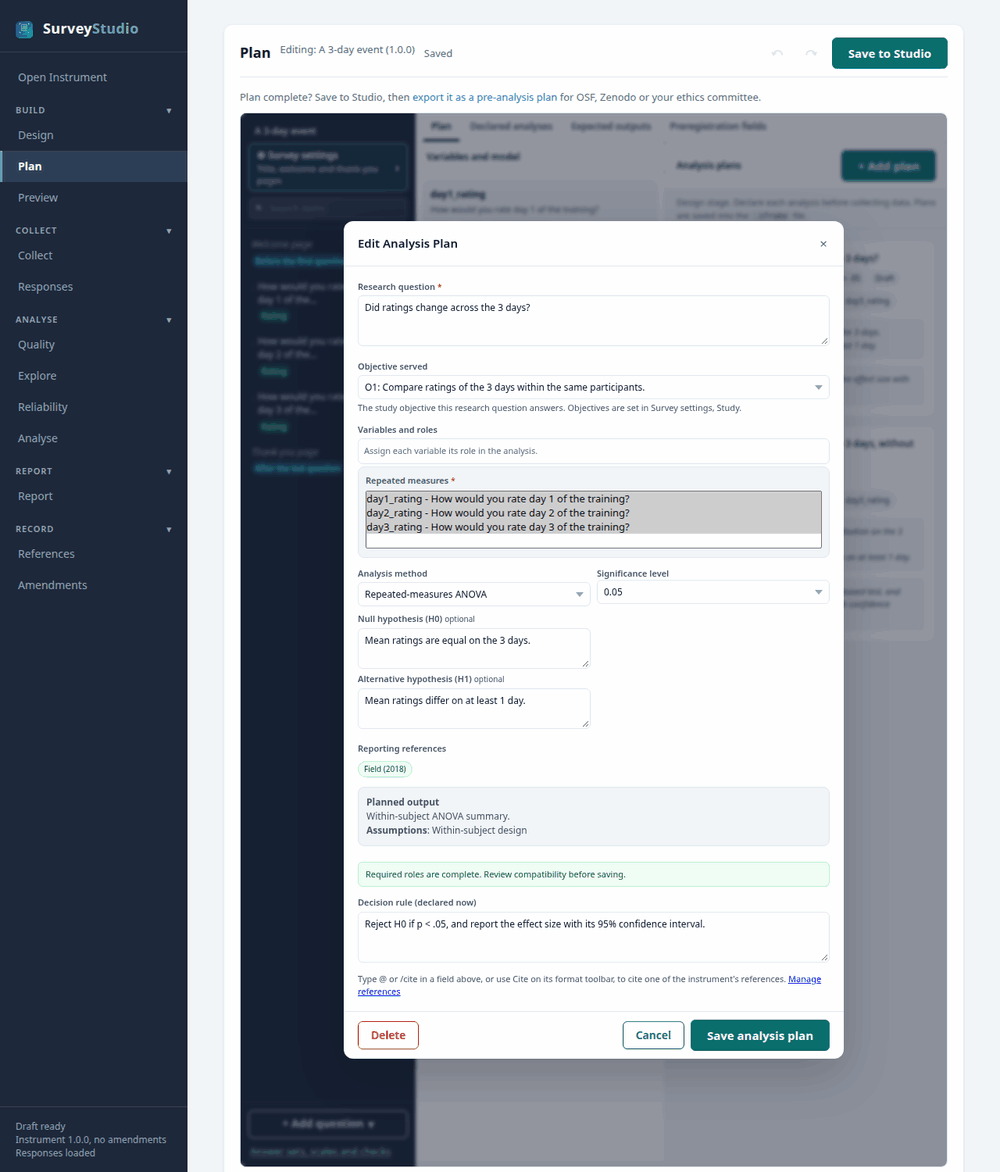
repeated demo.In the pre-analysis plan:
RQ1. Did ratings change across the 3 days? Null hypothesis (H0): Mean ratings are equal on the 3 days. Alternative hypothesis (H1): Mean ratings differ on at least 1 day. Planned decision rule: Reject H0 if p < .05, and report the effect size with its 95% confidence interval.
In the report: the APA 7 sentence and a table, with a chart where the method has one, each titled with the research question.
References: Cohen, J. (1988). Statistical power analysis for the behavioral sciences (2nd ed.). Lawrence Erlbaum. Fisher, R. A. (1925). Statistical methods for research workers. Oliver & Boyd.
Friedman test
repeated demo.In the pre-analysis plan:
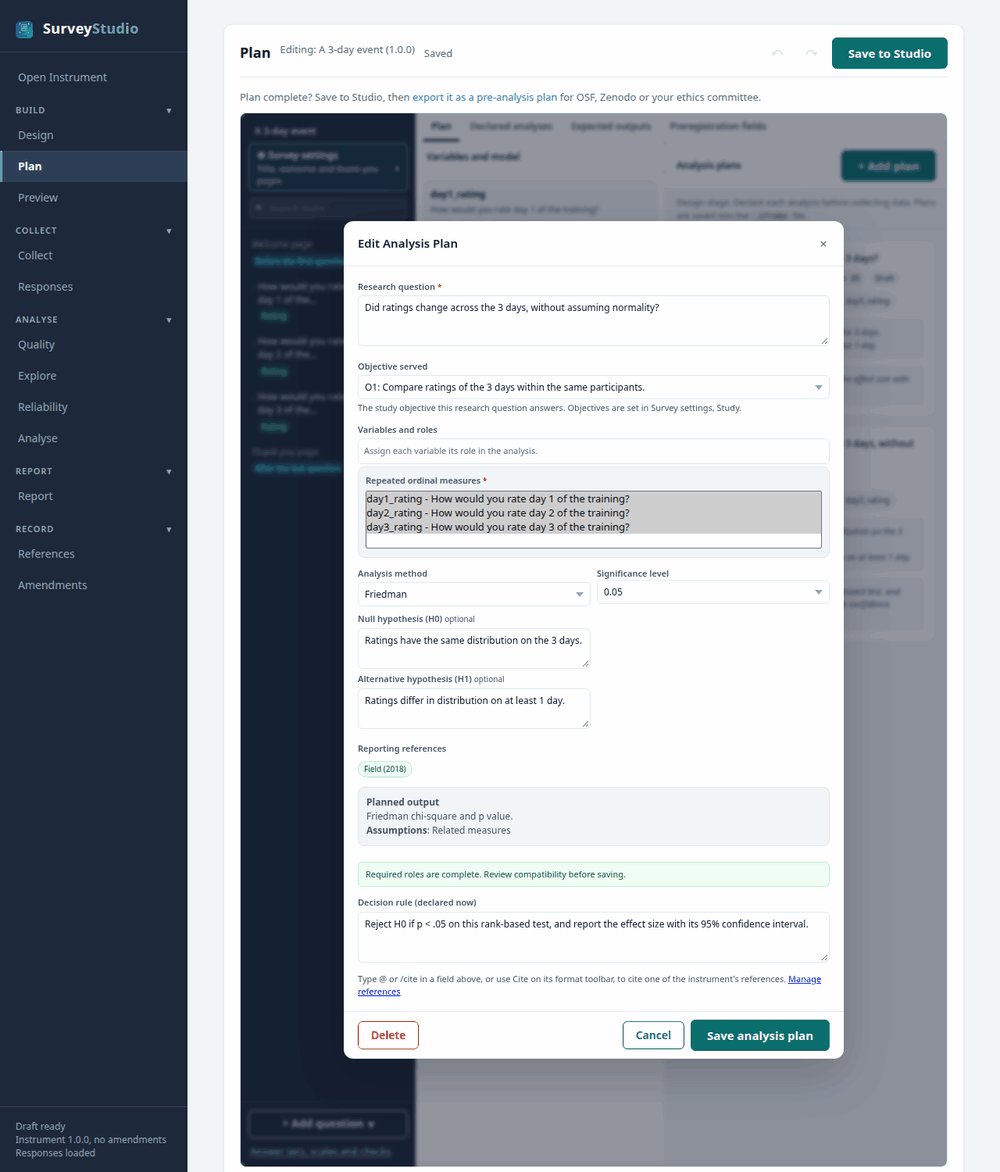
RQ2. Did ratings change across the 3 days, without assuming normality? Null hypothesis (H0): Ratings have the same distribution on the 3 days. Alternative hypothesis (H1): Ratings differ in distribution on at least 1 day. Planned decision rule: Reject H0 if p < .05 on this rank-based test, and report the effect size with its 95% confidence interval.
In the report: the APA 7 sentence and a table, with a chart where the method has one, each titled with the research question.
Cochran’s Q test
multi_response demo.In the pre-analysis plan:
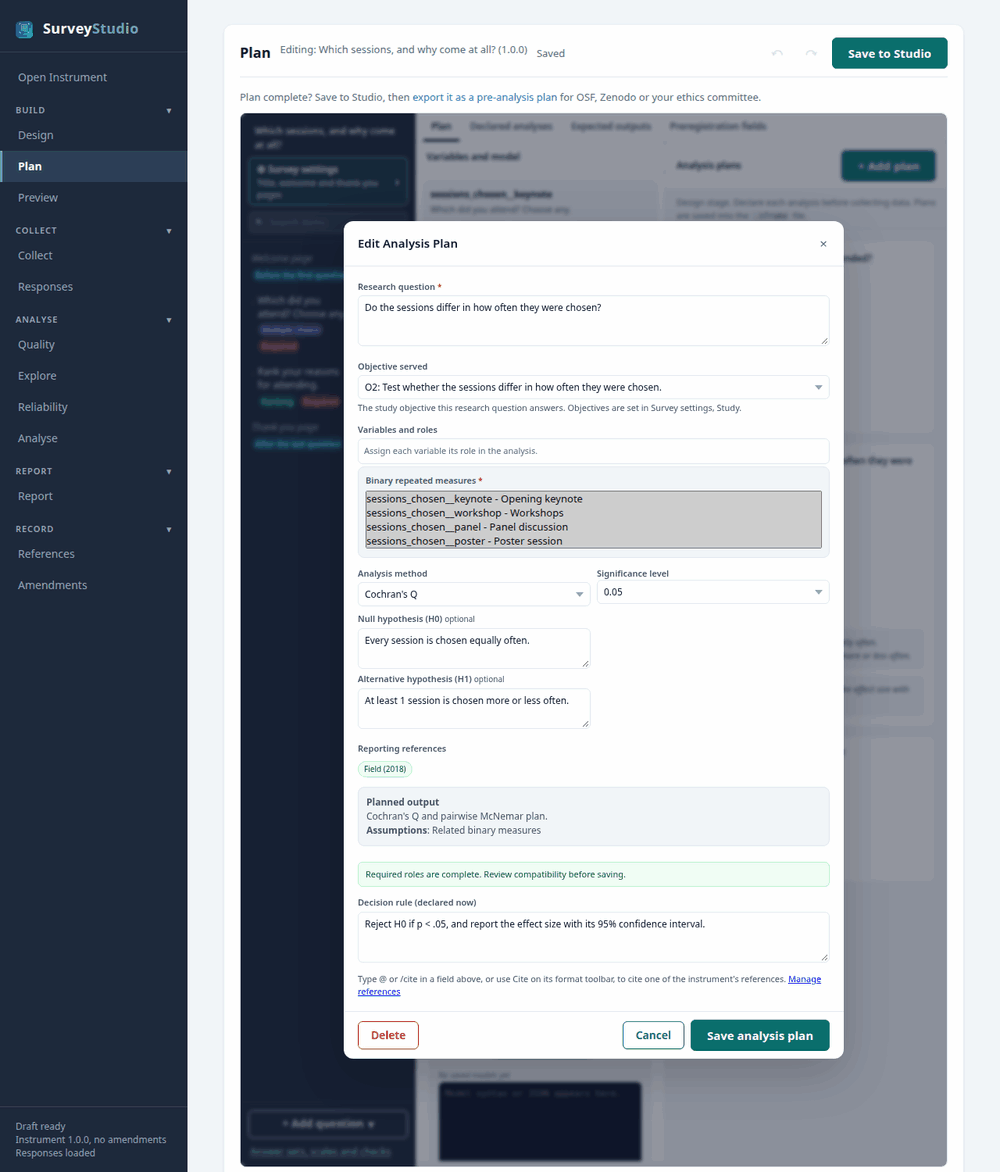
RQ2. Do the sessions differ in how often they were chosen? Null hypothesis (H0): Every session is chosen equally often. Alternative hypothesis (H1): At least 1 session is chosen more or less often. Planned decision rule: Reject H0 if p < .05, and report the effect size with its 95% confidence interval.
In the report: the APA 7 sentence and a table, with a chart where the method has one, each titled with the research question.