
How to analyse a grid of rating questions
Source:vignettes/articles/guides/analyse-a-grid-of-rating-questions.Rmd
analyse-a-grid-of-rating-questions.RmdSummarise the ratings for each row of a grid question and compare them between groups.
The example in this guide is Rate each session. A course evaluation in which students rate each part of a course on one grid, compared across students who attended in person and online.
In SurveyStudio
- In RStudio, open the Addins menu, choose
surveyframe: Try a demo and pick
matrix_likert. - On Design, select the grid. Each row becomes its own column in the data, named after the row.
- On Explore, view the distribution of ratings for each row.
- On Analyse, run the descriptives for every row and the cross-tabulation of 1 row by attendance format.
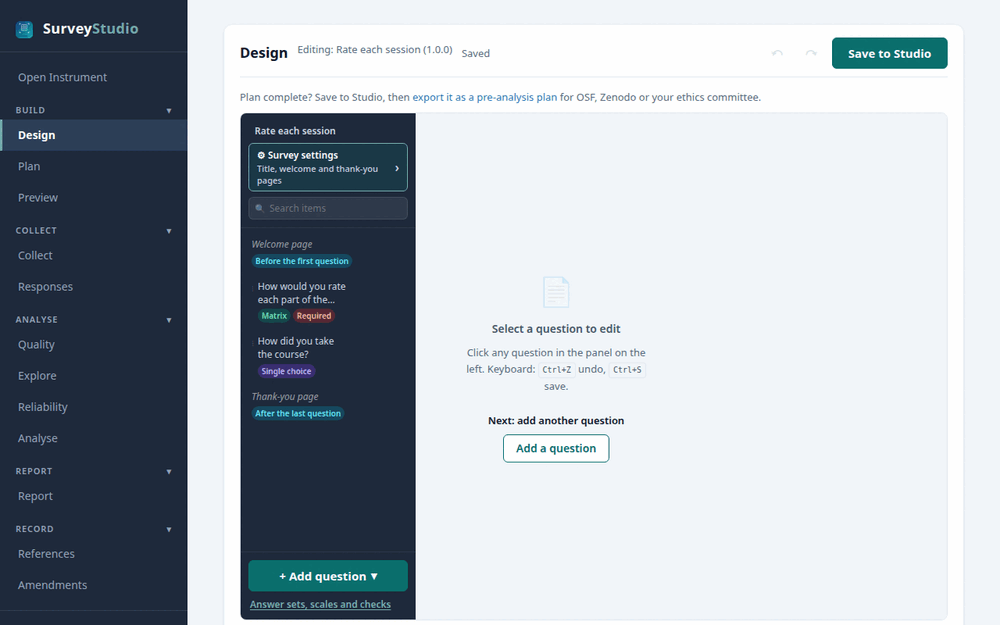
The Design screen with the Rate each session
study open.
In R
d <- sframe_demo("matrix_likert")
names(d$responses)                  # 1 column per grid row
results <- run_analysis_plan(d$responses, d$instrument)
The research questions and what the report gives
| Research question | Method | What the report gives |
|---|---|---|
| How was each part of the course rated? | Descriptive statistics | The APA 7 sentence and a table, with a chart where the method has one |
| How were ratings of the lectures distributed? | Frequencies and percentages | The APA 7 sentence and a table, with a chart where the method has one |
| Did in-person and online students rate the lectures differently? | Cross-tabulation | The APA 7 sentence and a table, with a chart where the method has one |
Run the example in SurveyStudio or R to see the results, each marked as demonstration data.