
How to check whether your items measure the factors you assumed
Source:vignettes/articles/guides/check-whether-your-items-measure-the-factors-you-assumed.Rmd
check-whether-your-items-measure-the-factors-you-assumed.RmdExplore whether your items group into the factors you expected.
The example in this guide is Employee engagement at work. An employee engagement survey of 8 items, written to measure 2 things employees judge: how their work is organised, and the content of their work.
In SurveyStudio
- In RStudio, open the Addins menu, choose
surveyframe: Try a demo and pick
factor_structure. - On Design, see the 8 items written for 2 constructs.
- On Design, choose Plan. RQ1 checks whether the data suit factor analysis, and RQ2 estimates the factors and the items that load on each.
- On Analyse, run the plan and compare the loadings with the structure you expected.
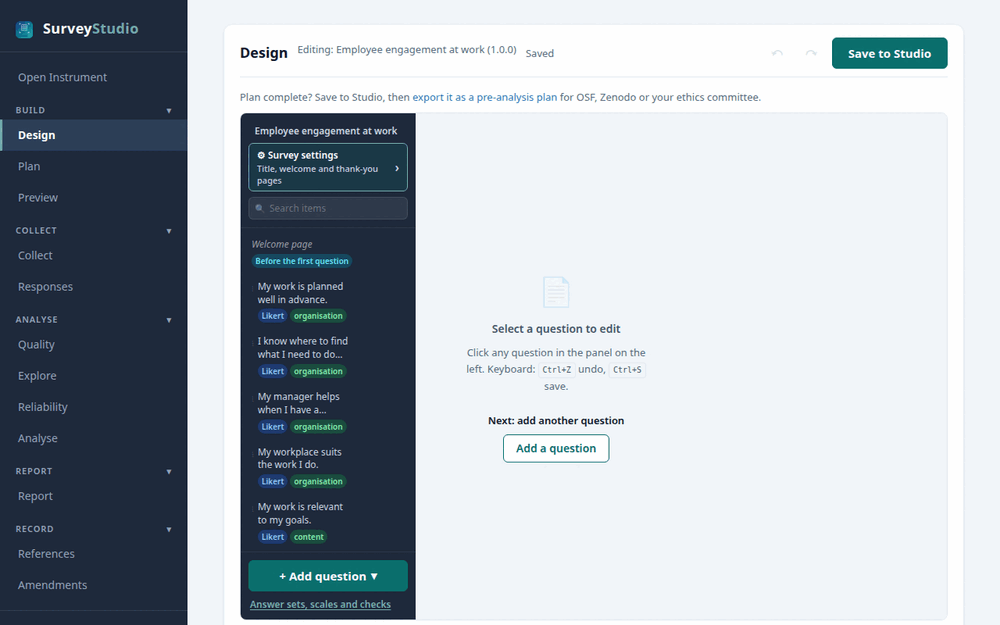
The Design screen with the Employee engagement
at work study open.
In R
d <- sframe_demo("factor_structure")
results <- run_analysis_plan(d$responses, d$instrument)
The research questions and what the report gives
| Research question | Method | What the report gives |
|---|---|---|
| Is this data suitable for factor analysis? | Factorability checks (KMO and Bartlett’s test) | The APA 7 sentence and a table, with a chart where the method has one |
| How many factors, and which items load where? | Exploratory factor analysis | The APA 7 sentence and a table, with a chart where the method has one |
Run the example in SurveyStudio or R to see the results, each marked as demonstration data.