
How to test a measurement and structural model
Source:vignettes/articles/guides/test-a-measurement-and-structural-model.Rmd
test-a-measurement-and-structural-model.RmdDeclare the measurement and structural model for your constructs, take its syntax to lavaan or seminr to fit it, and test mediation and moderation.
The example in this guide is Does content quality bring people back? A measurement and structural model study: whether the quality of a programme’s content builds satisfaction, and satisfaction the intention to return.
In SurveyStudio
- In RStudio, open the Addins menu, choose
surveyframe: Try a demo and pick
sem_pls. - On Design, see the 3 scales. Each construct of the model is 1 scale.
- On Design, choose Plan. RQ1, RQ2, RQ4 and RQ5 write the model syntax: lavaan for CFA and covariance-based SEM, seminr for PLS-SEM. RQ3 and RQ6 estimate mediation and moderation by regression.
- On Analyse, copy each syntax block into lavaan or seminr to fit the model, and read the mediation and moderation estimates.
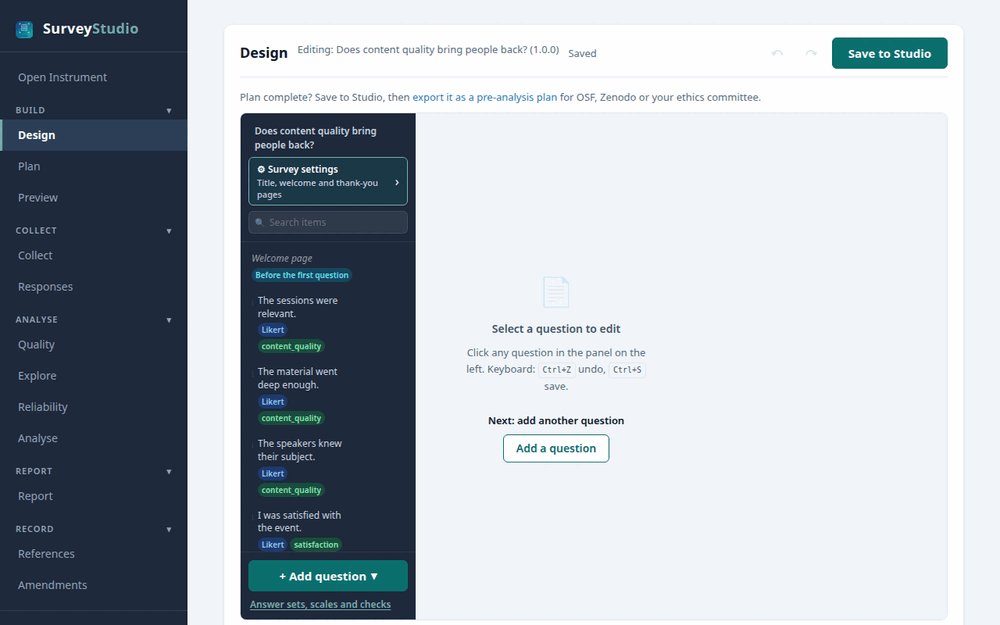
The Design screen with the Does content quality
bring people back? study open.
In R
d <- sframe_demo("sem_pls")
results <- run_analysis_plan(d$responses, d$instrument)
The research questions and what the report gives
| Research question | Method | What the report gives |
|---|---|---|
| What lavaan syntax does this model generate? | Structural equation model (lavaan syntax) | The model syntax, ready for you to fit in lavaan or seminr |
| And the seminr syntax for a PLS estimate? | PLS structural equation model (seminr syntax) | The model syntax, ready for you to fit in lavaan or seminr |
| Does satisfaction carry content quality through to intention? | Mediation analysis | The APA 7 sentence and a table, with a chart where the method has one |
| What CFA syntax does the measurement model generate? | Confirmatory factor analysis (lavaan syntax) | The model syntax, ready for you to fit in lavaan or seminr |
| And what seminr code would estimate the PLS model? | PLS structural equation model | The model syntax, ready for you to fit in lavaan or seminr |
| Does content quality matter more to some attendees than others? | Moderation analysis | The APA 7 sentence and a table, with a chart where the method has one |
Run the example in SurveyStudio or R to see the results, each marked as demonstration data.