
Every function in surveyframe is documented. That is a different thing from knowing which survey to build, so this article works the other way round: it starts from the survey you are trying to run and shows the whole path, from the questionnaire to the report.
There are 25 demos: 19 analysis examples, 3 presentation examples, and 3 provenance examples. Each has an instrument, response data, a codebook, and surveyframe’s expected results. Presentation and provenance demos reuse the matching analysis data where appropriate.
head(sframe_list_demos()[, c("name", "teaches")], 5)Try the shortest complete route first:
demo <- sframe_demo("first_survey")
results <- run_analysis_plan(demo$responses, demo$instrument)
sframe_demo_qmd("first_survey") # write an editable Quarto notebook
The package stores the 25 compact instruments and datasets, and
generates a notebook only when you ask: sframe_demo_qmd()
creates one for whichever demo you choose.
Read this as your own field
Every demo describes an event, its attendees and its sessions. That reads as a conference, a training day, a health promotion event, a product launch or a community meeting, so translate it once and then stop noticing:
| In these demos | Read it as |
|---|---|
| attendees | patients, customers, participants, employees, delegates |
| sessions | consultations, touchpoints, lessons, clinics, product features |
| the event | a programme, a service, a campaign, a course, an intervention |
| intention to return | adherence, repurchase, retention, re-enrolment |
The designs are the same whatever the setting. A before-and-after measure is a before-and-after measure whether the thing in between is a workshop or a clinic appointment.
Which demo do I need?
Choose by the data you have, and let the name of the test follow from it.
| You have | Use | Demo |
|---|---|---|
| A few questions and no plan yet | Start here | first_survey |
| 4 items meant to measure one thing | A scale, and its reliability | likert_scale |
| A grid of items rated on one scale | A matrix item | matrix_likert |
| 1 number and 2 groups | A 2-group comparison | two_group |
| The same people measured twice | A paired test | paired |
| 1 number and 3 or more groups | ANOVA and its alternatives | multi_group |
| The same people measured 3 times | Repeated measures | repeated |
| 2 categorical questions | A crosstab and a test of association | categorical |
| 4 numbers that may go together | Correlation and regression | correlation_regression |
| A yes/no, ordered, or multi-category outcome | Logistic regression | logistic |
| Many items and a hunch about the structure | Factor analysis | factor_structure |
| Constructs and a path model | SEM and PLS | sem_pls |
| Questions only some people should see | Skip logic | branching |
| Free-text answers | Text analysis | open_text |
| A decision between options on 4 criteria | MCDA | mcdm_choice |
| Fewer than 30 respondents | Small-sample methods | small_sample |
| Tick-all-that-apply, or a ranking | Items that expand | multi_response |
The remaining 5 demos teach presentation and provenance, not a new statistical method:
| You want to learn | Demo |
|---|---|
| A welcome page, logo, colour, and thank-you page | branded_survey |
| One-question-at-a-time presentation | conversational_survey |
| Conversational presentation with skip logic | conversational_branching |
| A disclosed mid-study revision | instrument_revision |
| Integrity checking and a deliberately altered file | verification |
The shape of every study
The path is the same each time, and surveyframe holds the questionnaire, the plan, the data contract and the report together as one object.
    design ->  export  ->  collect  ->  read  ->  analyse  ->  report
  sframe_instrument()   export_survey()   read_responses()   render_report()
                    run_survey(mode = "shiny")   run_analysis_plan()
The step that matters is the first one. The analysis plan is declared inside the instrument, before any data exists, so running it later is the execution of a contract, which is what separates it from a search for something significant.
Start here: your first survey
demo <- sframe_demo("first_survey")
demo$instrument
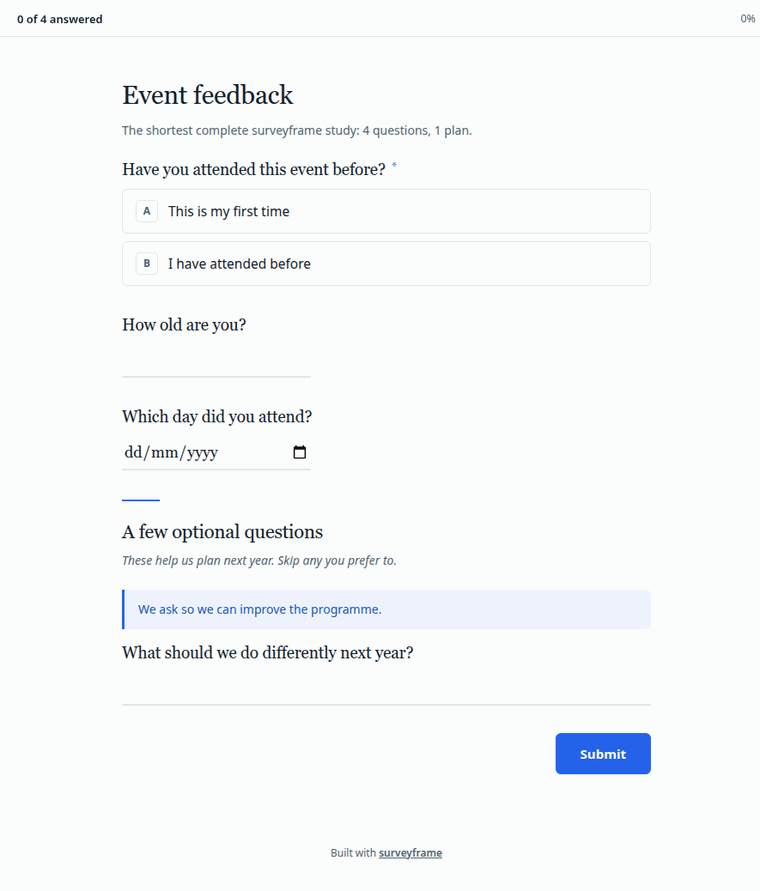
4 questions, a section break, and a plan with 4 blocks. This is what a respondent sees:
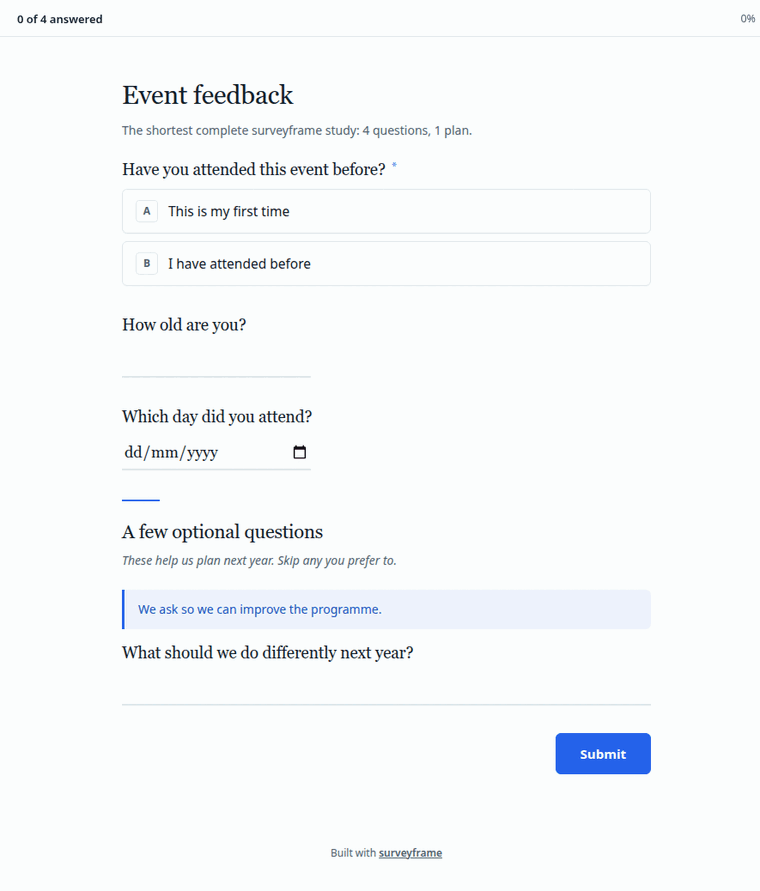
The plan was written at design time:
do.call(rbind, lapply(sframe_plan(demo$instrument), function(b) {
  data.frame(id = b$id, question = b$research_question, method = b$method)
}))
And running it is one call:
results <- run_analysis_plan(demo$responses, demo$instrument)
results[[1]]$apa
Adapt this for your own survey. Replace the items with your questions, declare your own plan, and the rest is unchanged.
Compare groups
Two groups on one outcome
The commonest comparison there is: 1 number, and 2 groups of people.
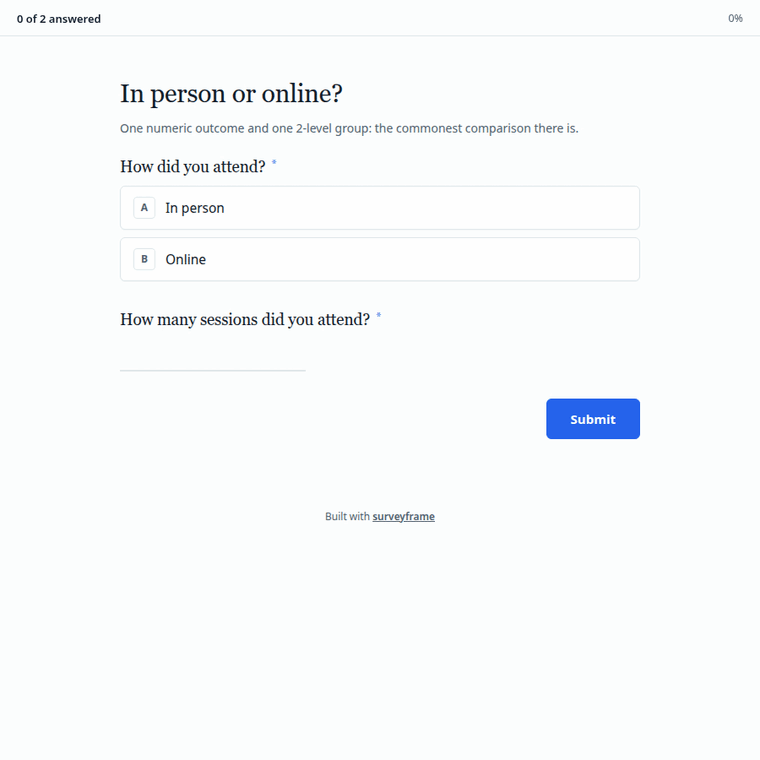
tg <- sframe_demo("two_group")
res <- run_analysis_plan(tg$responses, tg$instrument)
for (b in res) cat(b$test, ": ", b$apa, "\n", sep = "")
Both tests are shown for teaching. In a real study, predeclare the primary test from the research question, estimand, design, and defensible assumptions, before seeing which produces the smaller p-value. If useful, predeclare the other as a sensitivity analysis and label it as such when reporting both.
The same people, measured twice
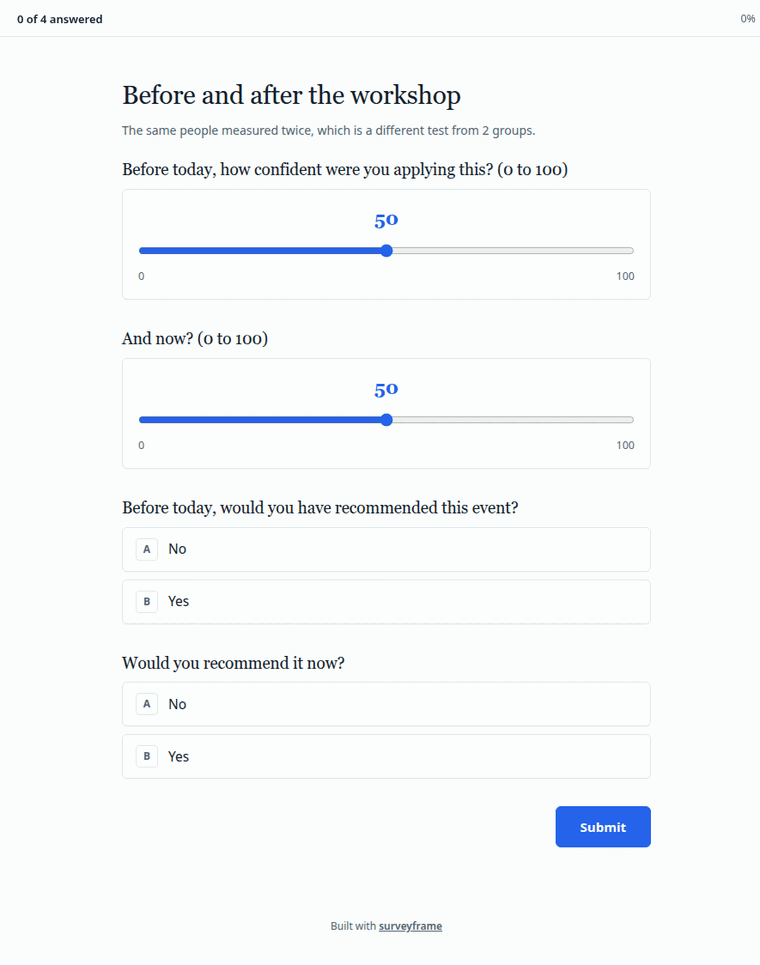
pr <- sframe_demo("paired")
for (b in run_analysis_plan(pr$responses, pr$instrument)) {
  cat(b$test, ": ", b$apa, "\n", sep = "")
}
Three groups, a second factor, and a covariate
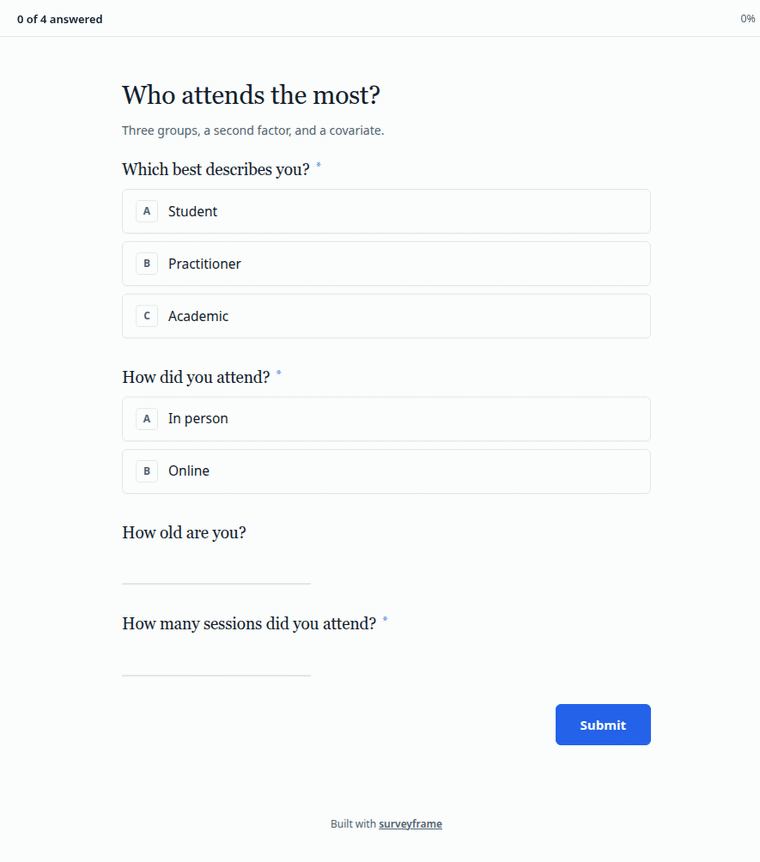
mg <- sframe_demo("multi_group")
for (b in run_analysis_plan(mg$responses, mg$instrument)[1:2]) {
  cat(b$test, ": ", b$apa, "\n", sep = "")
}
repeated and categorical follow the same
shape. See sframe_demo("repeated") and
sframe_demo("categorical").
Scales, structure and models
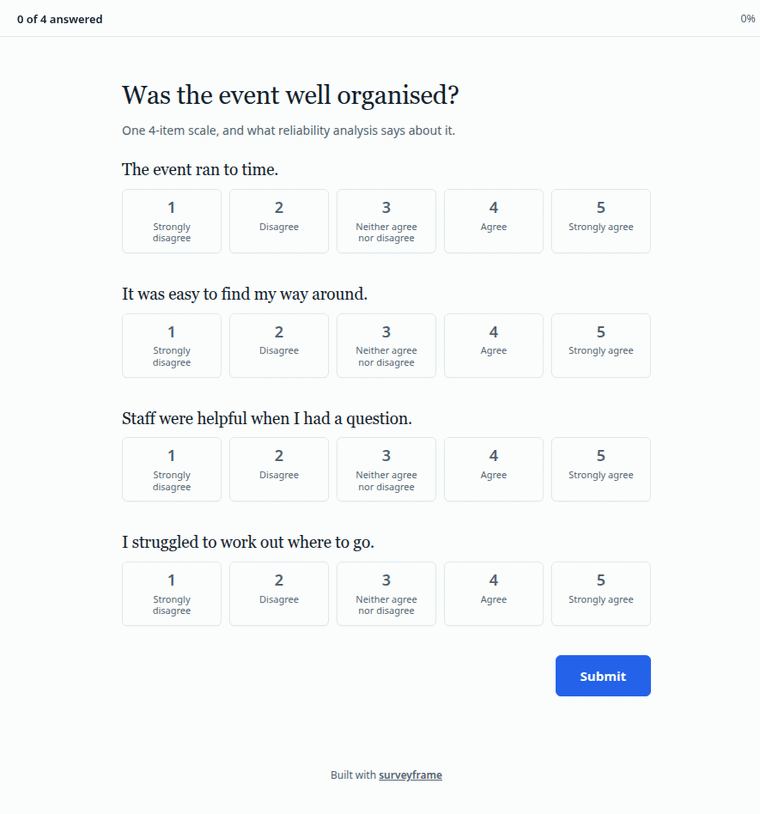
A scale, and whether it holds together
ls_demo <- sframe_demo("likert_scale")
rel <- sframe_reliability_results(ls_demo$responses, ls_demo$instrument)
as.data.frame(rel)[, c("scale_id", "n_items", "alpha")]
One item is reverse worded and declared with
reverse = TRUE, so scoring handles it and remembers for
you.
Factor structure, and a path model
factor_structure asks whether the data supports the
factors you assumed. sem_pls declares 3 constructs and a
path model, and generates the syntax for both lavaan and seminr. The
model type decides which: asking for PLS syntax from a covariance-based
model is refused, because it would estimate a different model from the
one you declared.
sem <- sframe_demo("sem_pls")
vapply(sframe_get_models(sem$instrument), function(m) m$type, character(1))
Question types worth meeting
A matrix item, and the columns it becomes
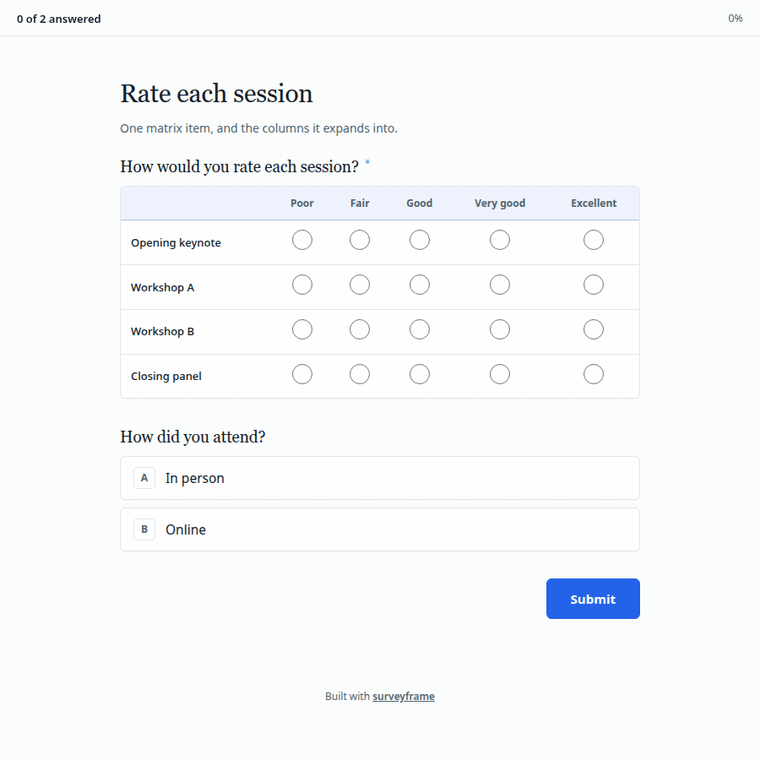
A matrix does not write one column named after the item. It expands, one column per row:
ml <- sframe_demo("matrix_likert")
grep("^session__", names(ml$responses), value = TRUE)
multiple_choice and ranking expand the same
way, one column per option. See
sframe_demo("multi_response").
A trap worth knowing. When a matrix row label
contains a space, the column does too, and read.csv() will
quietly rewrite session__Reading materials as
session__Reading.materials, which no longer matches the
contract the instrument declares. Read with
check.names = FALSE.
Questions only some people see
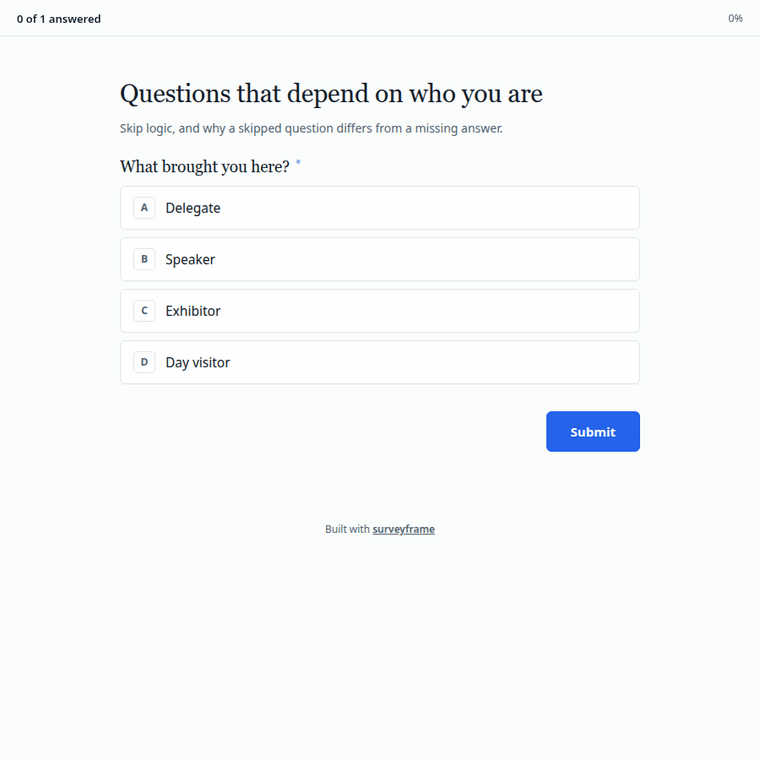
br <- sframe_demo("branching")
sframe_get_branches(br$instrument)[[1]]
A blank left by skip logic is structural, not missing data. The respondent was never asked. That distinction matters when you report completeness.
Free text
ot <- sframe_demo("open_text")
tf <- run_analysis_plan(ot$responses, ot$instrument)[[1]]
#> Warning in stm::stm(prepped$documents, prepped$vocab, K = k, verbose = FALSE):
#> K=2 is equivalent to a unidimensional scaling model which you may prefer.
head(tf$table, 5)
Make it yours
Every demo above ships with plain welcome, consent and thank-you
screens and the default look. The whole appearance of a survey lives in
one render block, which you can read, change and paste into
your own instrument:
sframe_demo("two_group", branded = TRUE)$instrument$renderApplied to any demo with branded = TRUE, which leaves
the files on disk as they are:
sframe_demo("two_group", branded = TRUE)Plain, then the welcome page a respondent meets first, then the questions:
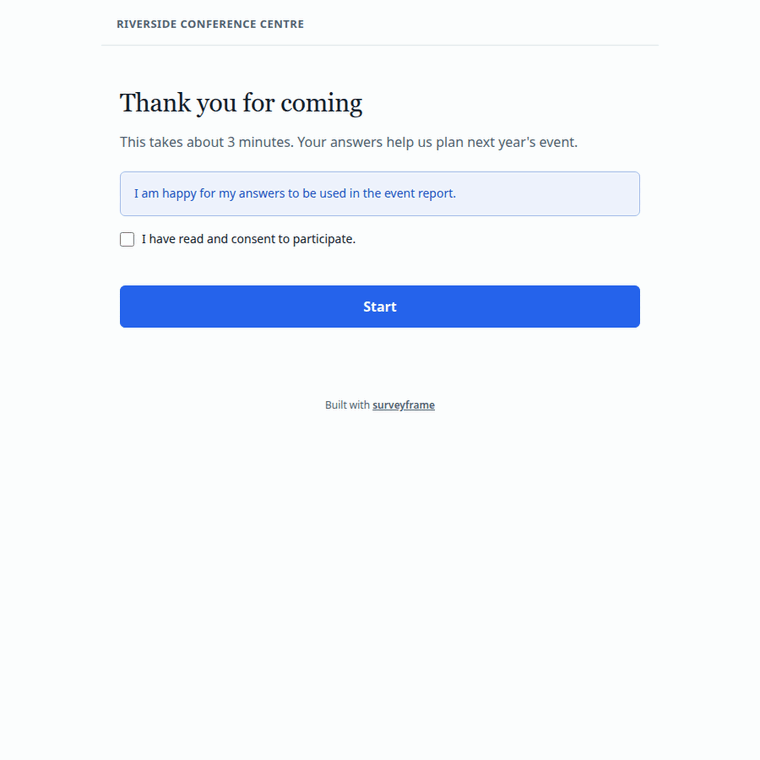
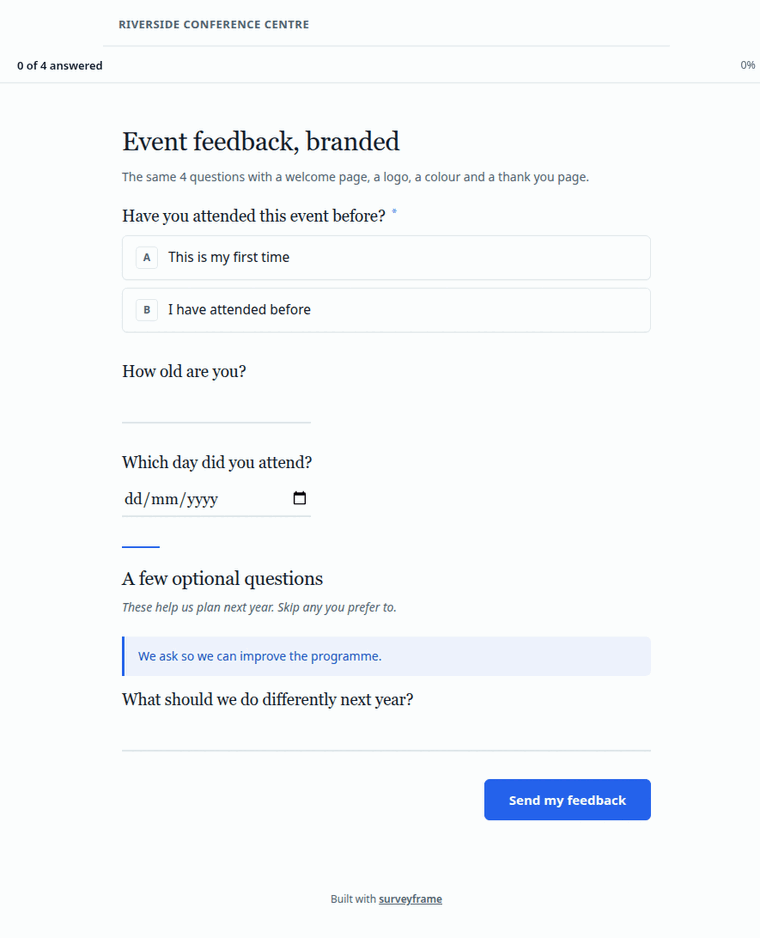
Consent is enforced: with consent_required = TRUE,
pressing Start without ticking the box refuses to continue.
One page, or one question at a time
render$mode takes "standard", which is
everything on one page, or "conversational", which is one
question at a time with a progress bar.
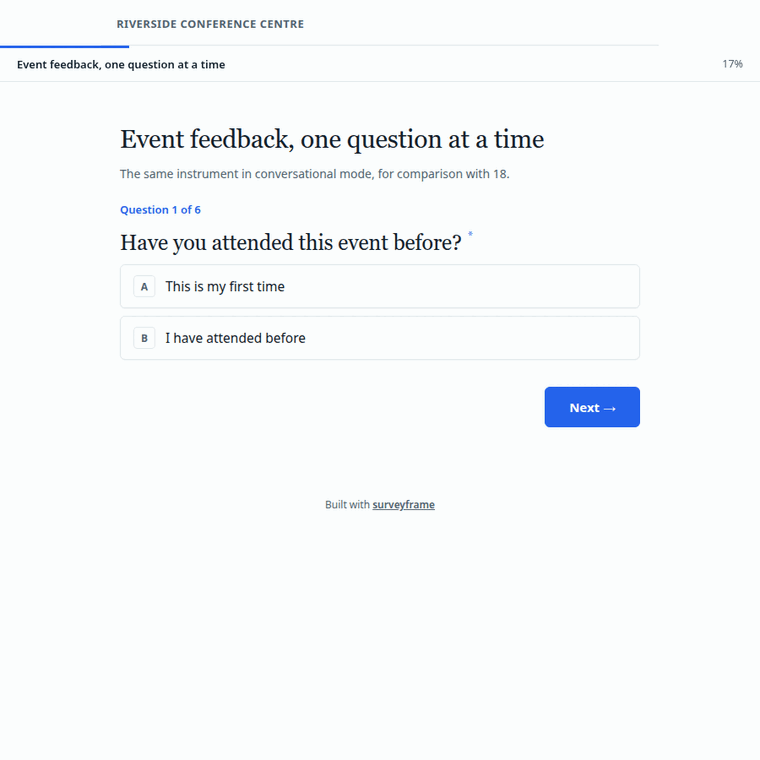
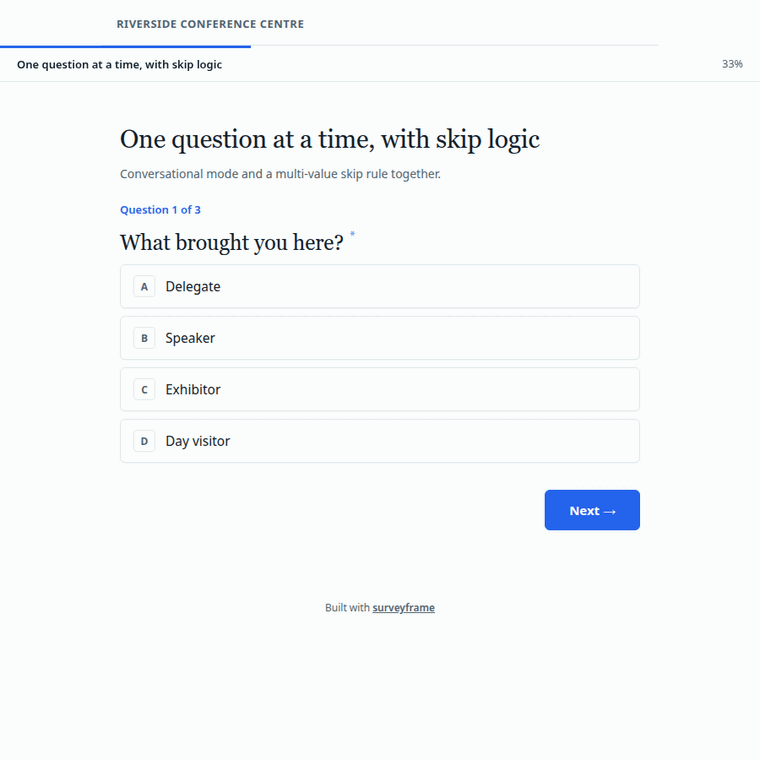
Conversational mode works with skip logic, which is the combination most likely to surprise: a hidden question is stepped over without leaving the respondent on a blank card.
Collect responses, and share the results
3 routes, and the same instrument serves all 3.
# 1. One self-contained HTML file you can host or email
export_survey(demo$instrument, "survey.html")

# 2. A Shiny app
run_survey(demo$instrument, mode = "shiny")

# 3. A Google Sheets collector, generated as an Apps Script
export_google_sheet(demo$instrument, sheet_url = "https://...")
Then the report:
render_report(demo$instrument, demo$responses, output_path = "report.html")render_report() prefers Quarto and falls back to a
built-in HTML writer. It tells you which one it used,
in a message, in an engine attribute on the path it
returns, and in the report itself beside the instrument hash and the
analysis seed. For a thesis or a journal,
plot_palette = "print" swaps the colour charts for
greyscale, and format = "pdf" writes a PDF.
Declare, revise, verify
This is what separates surveyframe from a form builder, and it is worth seeing before you decide whether to use it.
Changing an instrument mid-study, on the record
A pilot often shows that a question needs rewording. Doing that quietly leaves nobody able to tell which version a respondent saw.
rev <- sframe_demo("instrument_revision")
log <- as.data.frame(sframe_get_amendments(rev$instrument))
log[, c("reason_code", "tier", "reason_text")]
The amendment carries a reason code, a tier, an author and a deviation report, and it travels inside the instrument.
Proving a file is the one you think it is
Every .sframe written by the package carries a SHA-256
digest of its canonicalised content. The demo ships a clean file and a
tampered copy, altered in a single response label with the stored digest
left alone:
v <- sframe_demo("verification")
tampered <- file.path(dirname(v$instrument_path), "verification_tampered.sframe")
read_sframe(tampered)
#> Error in `sframe_abort_import()`:
#> ! Integrity check failed for '/home/runner/work/_temp/Library/surveyframe/extdata/demos/verification_tampered.sframe'. The file may have been modified after it was written. Expected hash: 47782aa2fb0b2d2ad1f23fd31aac7f7d502f85b7669f2c6679b8fc1b9c6335a1. Stored hash: 3db2149ca3c347d2f503c525ee9704fcb302fcf5887585e6cd211c9a0b8c9a12.
The altered file refuses to load because its content no longer matches its stored digest. This detects an undisclosed content change alone: authorship, research quality, and full amendment disclosure each need separate evidence. A file can also be checked outside R, on the documentation site’s Verify a file page.
Are you an instructor? Do you want to verify against established software?
Good. Please check us against the software you already trust.
Every demo ships 4 things: the instrument, the response data, a codebook of variable and value labels, and the results surveyframe produced.
d <- sframe_demo("two_group")
basename(unlist(d[c("instrument_path", "responses_path",
                    "codebook_path", "results_path")]))
Take them into psych, SPSS, JASP, jamovi or Stata, run
the same test, and compare.
export_responses(d$responses, d$instrument, "two_group.sav")The .sav arrives with the question wording and the
response options already attached, so your variables read “The event ran
to time.” and “Strongly disagree” in place of org_1 and
1. The plain CSV carries codes, and the
codebook is what gives them meaning, so use one or the other.
If a number comes out differently, we want to hear about it. Open an issue with the demo name, the software you used, and both results. A disagreement is either a bug worth fixing or a difference in method worth documenting, and either way we would like to hear it from you.
Run one yourself
An editable Quarto notebook can be generated for every demo: load, read, run the plan, render a report, and export for checking elsewhere.
sframe_demo_qmd("two_group")Render it, then start replacing the demo with your own study.
Found a bug, or something that could be clearer?
surveyframe is developed in the open at github.com/MohammedAliSharafuddin/surveyframe. Bug reports, questions, and suggestions for a demo that would have helped you are all welcome on the issue tracker. If a result looks wrong, please include the demo name and what you compared against, since that turns a report into something fixable in one step.